Principal Shareholders
(As of March 31, 2025)
| Rank | Shareholders | Investment in SQUARE ENIX | |
|---|---|---|---|
| (Thousands of Shares) | (%) | ||
| 1 | Yasuhiro Fukushima | 23,626 | 19.67 |
| 2 | The Master Trust Bank of Japan, Ltd. (Trust Account) | 13,515 | 11.25 |
| 3 | Fukushima Planning Co., Ltd. | 6,763 | 5.63 |
| 4 | JP MORGAN CHASE BANK 380752 | 6,448 | 5.36 |
| 5 | JP MORGAN CHASE BANK 380815 | 5,361 | 4.46 |
| 6 | Custody Bank of Japan, Ltd. (Trust Account) | 4,069 | 3.38 |
| 7 | BNY GCM CLIENT ACCOUNT JPRD AC ISG (FE-AC) | 3,865 | 3.21 |
| 8 | Mizuho Securities Co., Ltd. | 3,619 | 3.01 |
| 9 | THE CHASE MANHATTAN BANK, N. A. LONDON SPECIAL ACCOUNT NO.1 | 2,830 | 2.35 |
| 10 | HSBC HONG KONG-TREASURY SERVICES A/C ASIAN EQUITIES DERIVATIVES | 2,747 | 2.28 |
Notes:
The holding ratio is calculated without the treasury shares (2,431,591).
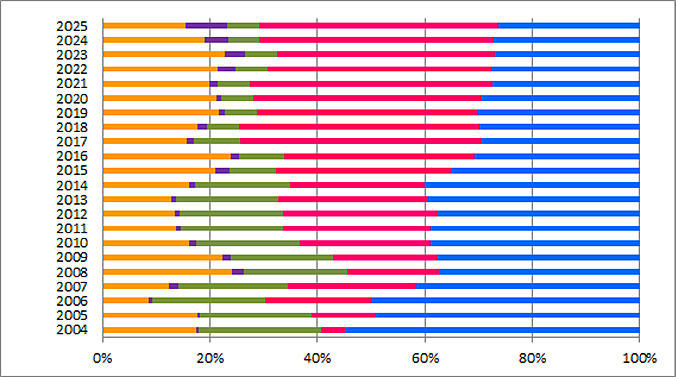
Share Ownership (Thousands of shares)
(As of March 31, 2025)
| ■Financial Institutions |
■Financial Instruments Company |
■Other Companies |
■Foreign Companies and Individuals |
■Individuals and Other |
Total | ||
|---|---|---|---|---|---|---|---|
| 2025 | 18,849 (15.39%) |
9,689 (7.91%) |
7,239 (5.91%) |
54,583 (44.55%) |
32,169 (26.25%) |
122,531 (100.00%) |
2024 | 23,402 (19.10%) |
5,178 (4.23%) |
7,223 (5.89%) |
53,512 (43.67%) |
33,215 (27.11%) |
122,531 (100.00%) |
| 2023 | 27,929 (22.79%) |
4,600 (3.75%) |
7,211 (5.89%) |
49,687 (40.55%) |
33,101 (27.02%) |
122,531 (100.00%) |
|
| 2022 | 26,224 (21.40%) |
4,000 (3.26%) |
7,310 (5.97%) |
51,033 (41.65%) |
33,962 (27.72%) |
122,531 (100.00%) |
|
| 2021 | 24,395 (19.91%) |
1,951 (1.59%) |
7,272 (5.94%) |
55,273 (45.11%) |
33,638 (27.46%) |
122,531 (100.00%) |
|
| 2020 | 26,065 (21.27%) |
1,076 (0.88%) |
7,352 (6.00%) |
52,087 (42.51%) |
35,948 (29.34%) |
122,531 (100.00%) |
|
| 2019 | 26,562 (21.67%) |
1,390 (1.13%) |
7,373 (6.02%) |
50,459 (41.18%) |
36,745 (29.98%) |
122,531 (100.00%) |
|
| 2018 | 21,626 (17.67%) |
2,037 (1.67%) |
7,409 (6.05%) |
54,920 (44.87%) |
36,404 (29.75%) |
122,398 (100.0%) |
|
| 2017 | 19,042 (15.56%) |
1,902 (1.55%) |
10,409 (8.51%) |
55,067 (45.00%) |
35,951 (29.38%) |
122,373 (100.0%) |
|
| 2016 | 29,231 (23.91%) |
1,717 (1.40%) |
10,424 (8.52%) |
43,256 (35.37%) |
37,669 (30.80%) |
122,299 (100.0%) |
|
| 2015 | 25,588 (20.93%) |
3,291 (2.69%) |
10,630 (8.70%) |
40,135 (32.84%) |
42,586 (34.84%) |
122,232 (100.0%) |
|
| 2014 | 18,722 (16.20%) |
1,114 (0.96%) |
20,570 (17.80%) |
28,817 (24.93%) |
46,350 (40.10%) |
115,575 (100.0%) |
|
| 2013 | 14,700 (12.74%) |
995 (0.86%) |
22,092 (19.15%) |
32,251 (27.95%) |
45,329 (39.29%) |
115,370 (100.0%) |
|
| 2012 | 15,485 (13.4%) |
995 (0.9%) |
22,089 (19.2%) |
33,268 (28.8%) |
43,530 (37.7%) |
115,370 (100.0%) |
|
| 2011 | 15,711 (13.6%) |
981 (0.9%) |
22,122 (19.2%) |
31,668 (27.4%) |
44,884 (38.9%) |
115,370 (100.0%) |
|
| 2010 | 18,643 (16.2%) |
1,479 (1.3%) |
22,161 (19.2%) |
28,029 (24.3%) |
45,055 (39.0%) |
115,370 (100.0%) |
|
| 2009 | 25,770 (22.4%) |
1,558 (1.4%) |
22,190 (19.2%) |
22,271 (19.3%) |
43,514 (37.7%) |
115,305 (100.0%) |
|
| 2008 | 27,760 (24.1%) |
2,678 (2.3%) |
22,148 (19.2%) |
19,620 (17.1%) |
42,909 (37.3%) |
115,117 (100.0%) |
|
| 2007 | 13,756 (12.4%) |
1,843 (1.7%) |
22,553 (20.3%) |
26,801 (24.1%) |
45,992 (41.5%) |
110,947 (100.0%) |
|
| 2006 | 9,456 (8.5%) |
822 (0.8%) |
23,178 (20.9%) |
21,761 (19.7%) |
55,510 (50.1%) |
110,729 (100.0%) |
|
| 2005 | 19,475 (17.7%) |
374 (0.3%) |
23,117 (20.9%) |
13,252 (12.0%) |
54,164 (49.1%) |
110,385 (100.0%) |
|
| 2004 | 19,225 (17.5%) |
486 (0.4%) |
25,023 (22.7%) |
4,914 (4.5%) |
60,481 (54.9%) |
110,130 (100.0%) |